Power BI
Integrate YSoft SafeQ with Power BI
Prerequisites
Downloaded and installed Power BI Desktop: https://www.microsoft.com/en-us/download/details.aspx?id=45331
Enterprise Reporting is enabled and configured, see more Data Mart Mode Configuration for more detail.
Option 1: Import Y Soft Template
To enjoy the full potential of Power BI, one will need to develop a Power BI template for the organizations specific enterprise reporting requirements. However, to get a head-start on such an effort, Y Soft has developed a set of Power BI templates. You can find full description of template import in Power BI Desktop - Import Template article.
Option 2: Create Your Own Report
Import data from a SQL Server database.
PostgreSQL server database engine:
Install ODBC driver, see PostgreSQL ODBC driver for Power BI.
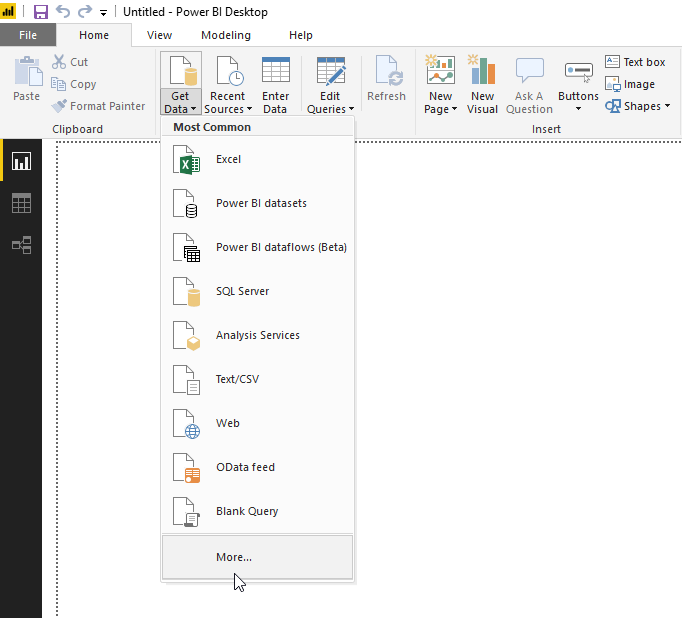
Select More option as shown below.
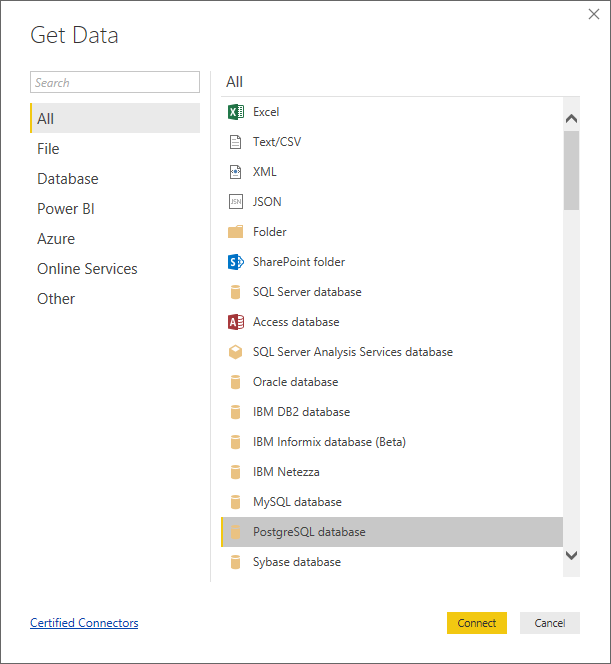
Select PostgreSQL database option.
Specify the IP address of the database server and name of the database associated with YSoft SafeQ:
At this point you may need to add Npgsql dependency for Power BI.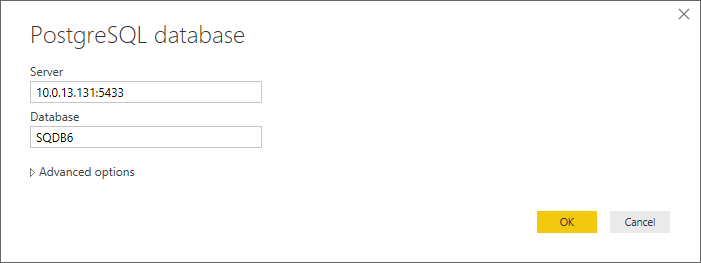
MS SQL server database engine:
Install ODBC driver, see MS SQL ODBC driver for Power BI.
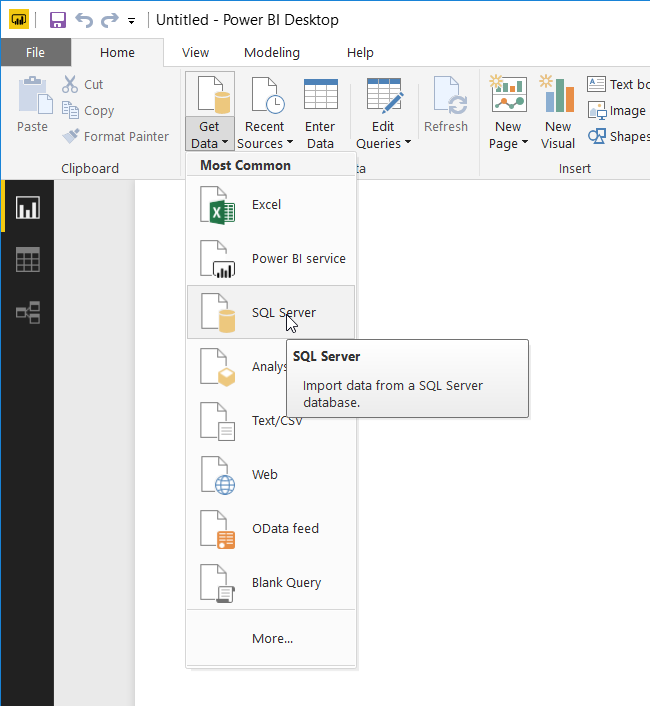
Select SQL Server" option as shown below.
Specify the IP address of the database server and name of the database associated with YSoft SafeQ:
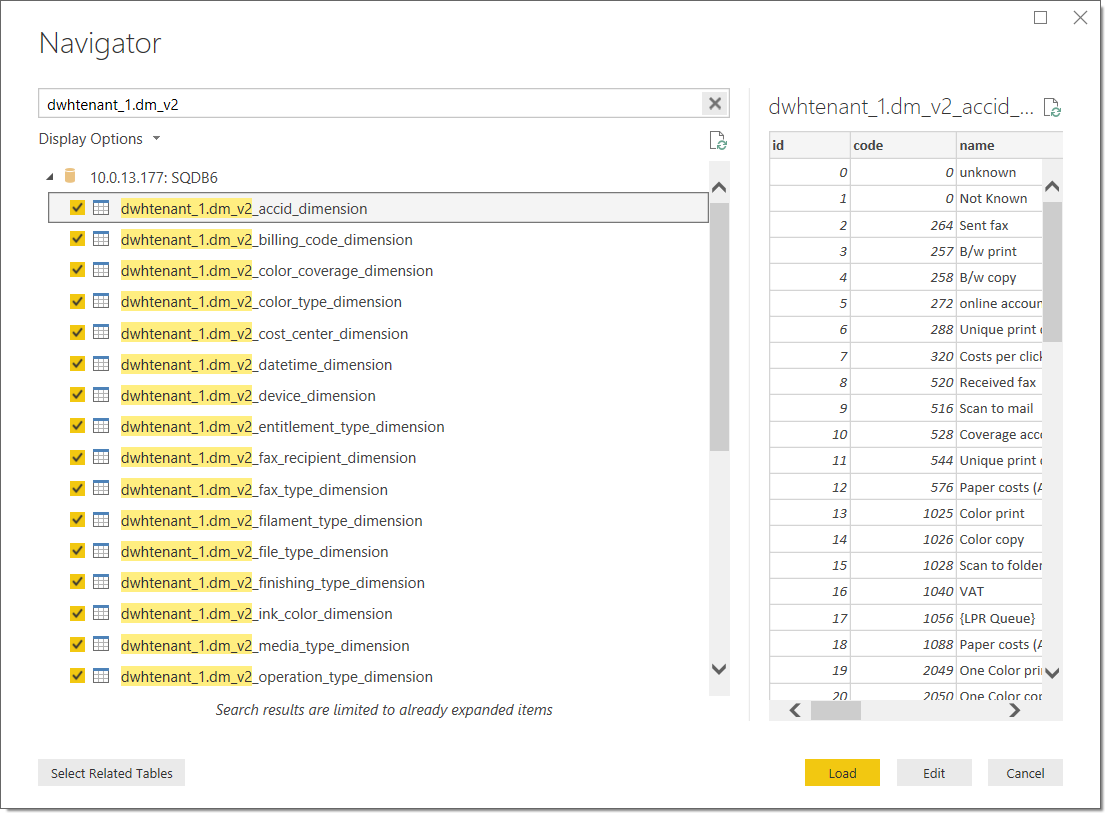
Filter data mart tables in Navigator and select all tables with prefix "dwhtenant_1.dm_v2". Click on Load button.
Wait for the data to load, this step takes a few minutes, depending on the database size.
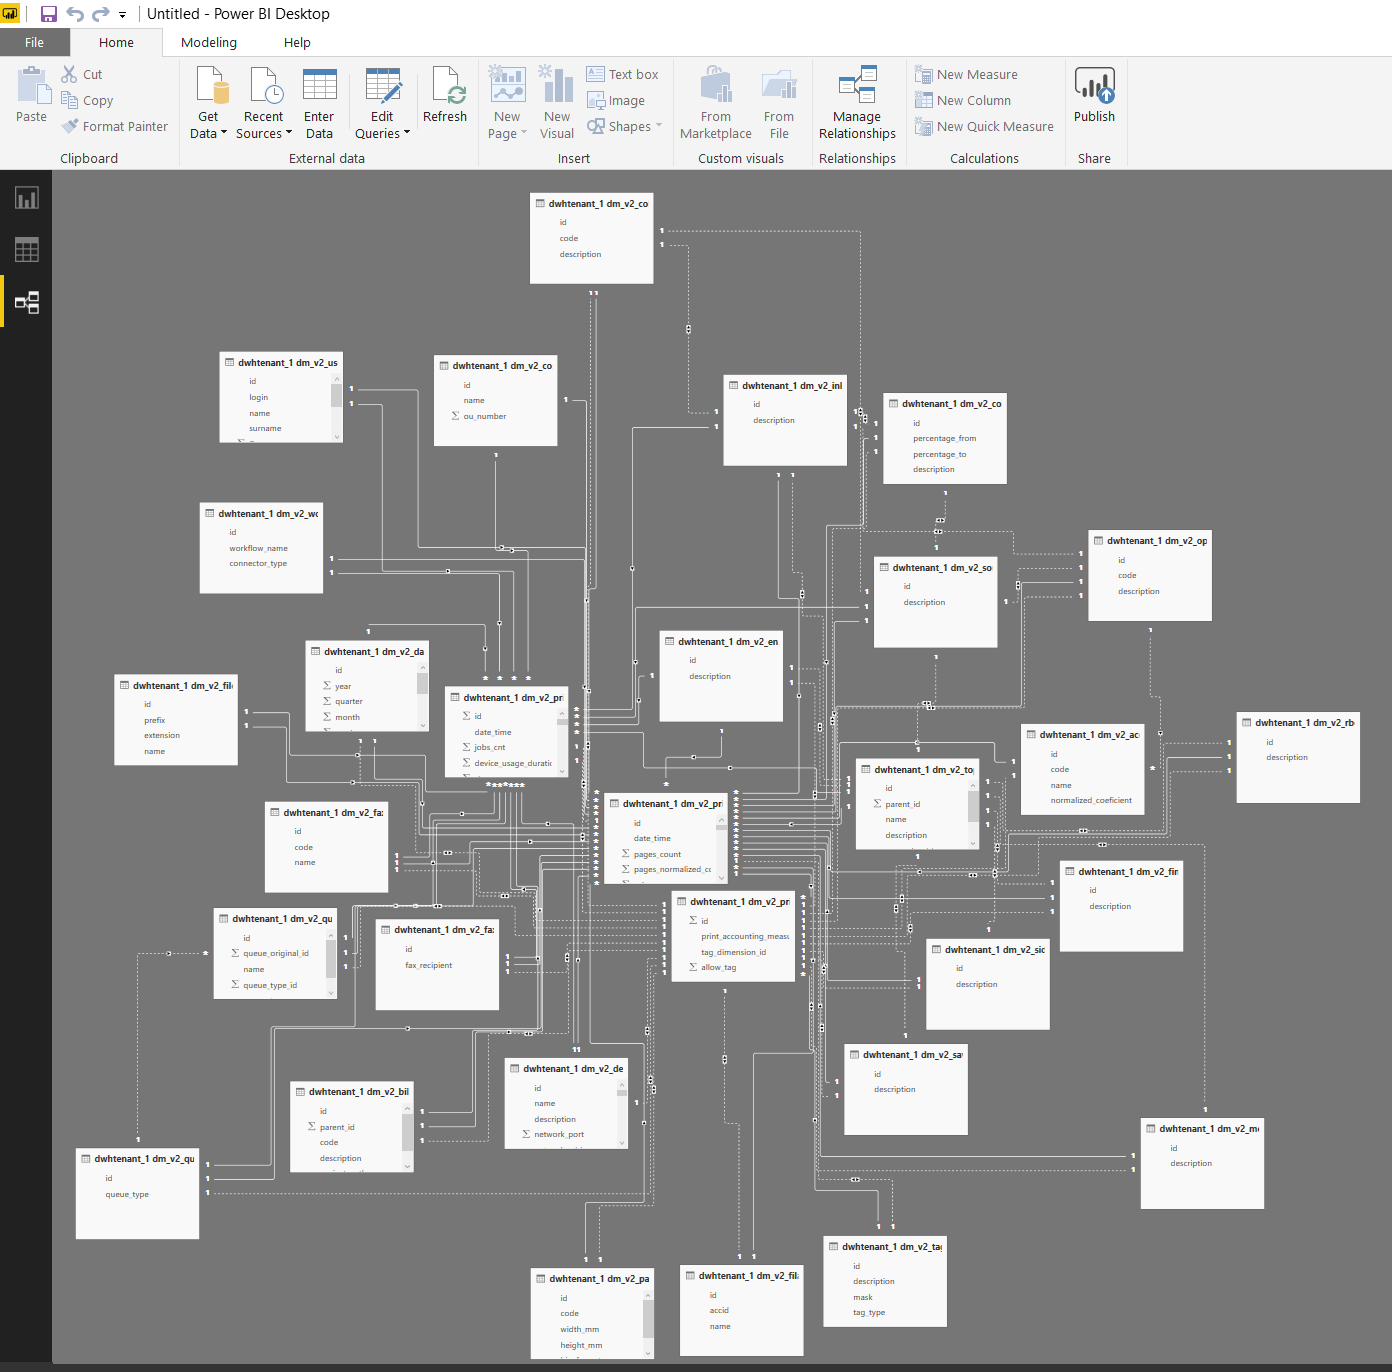
Result - The relationship diagram between the tables is available on vertical tab Relationships.
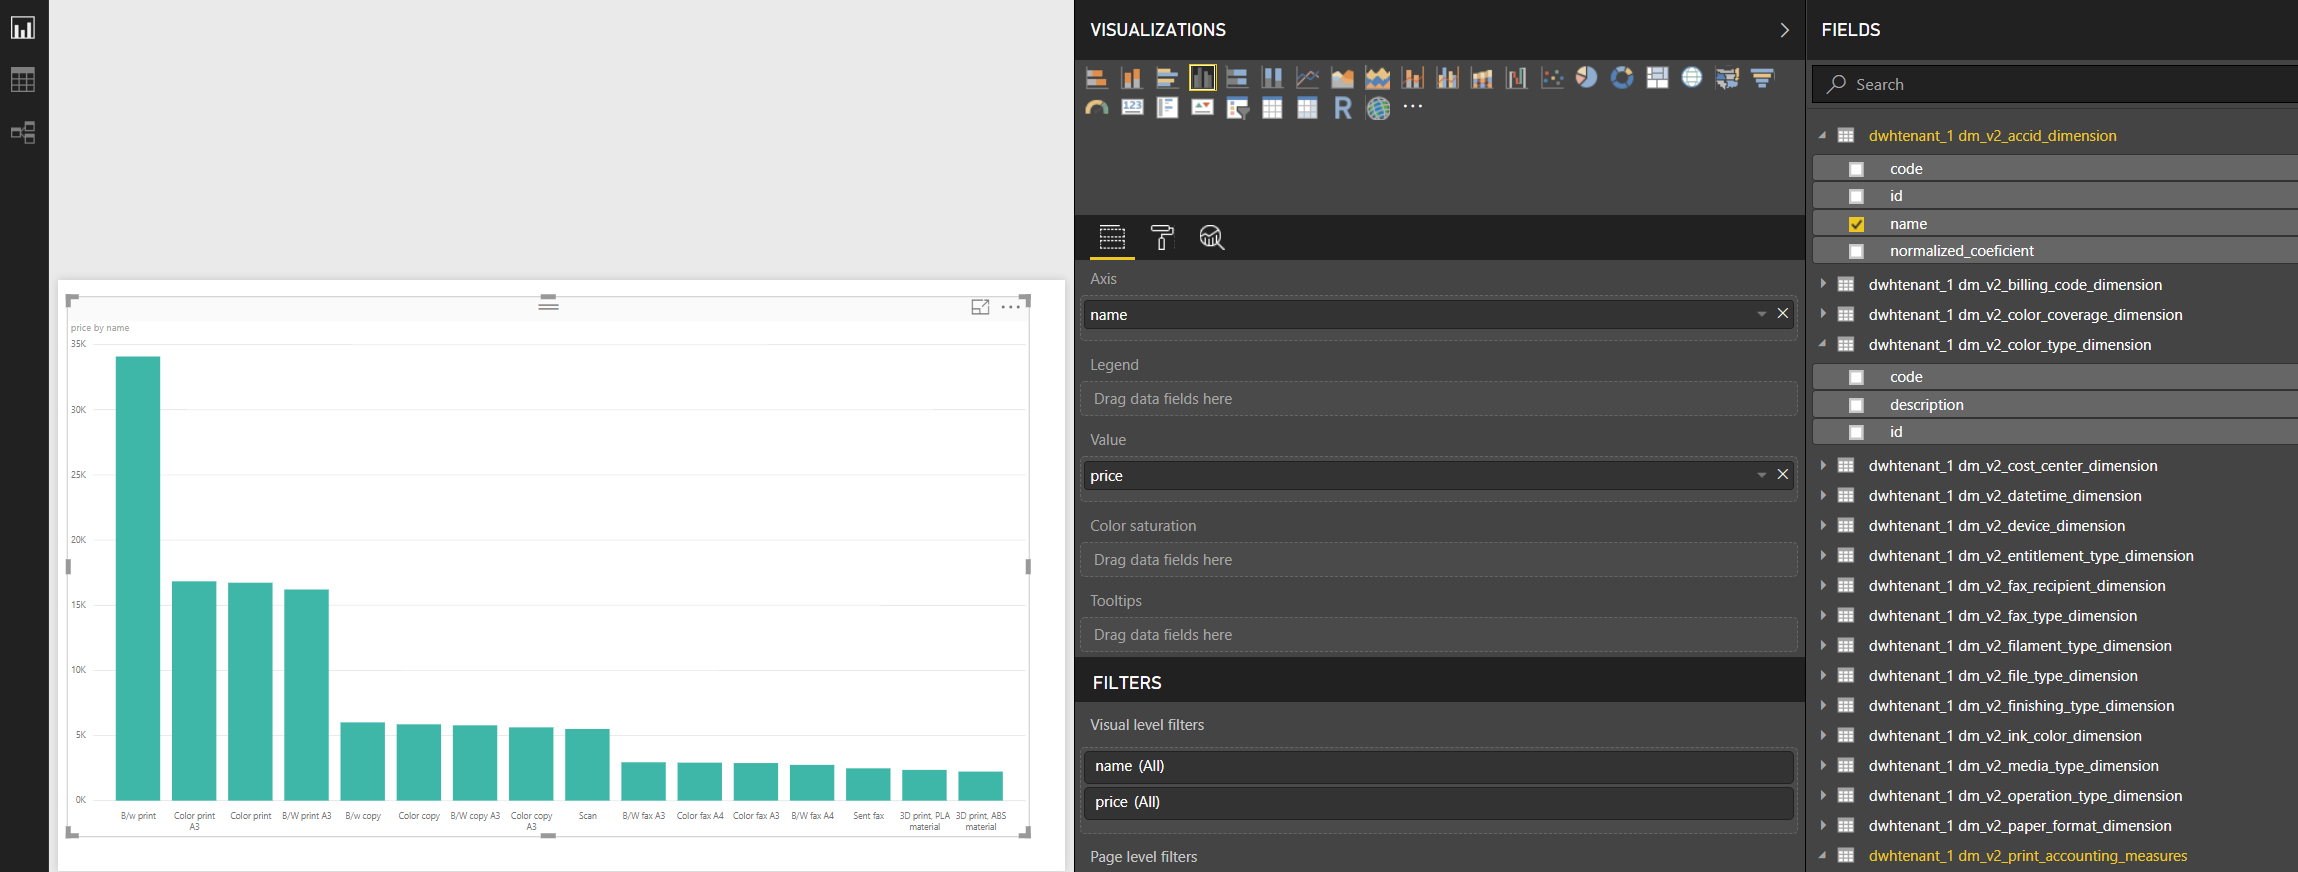
Add a Sample Graph
Generate Chart - Select the Power BI report view from the left pane and select various data to create and render different charts. For example, what is depicted is a simple selection of the ACCID dimension rendered into a Bar Chart.
References:
Microsoft documentation for Power BI designers: https://docs.microsoft.com/en-us/power-bi/power-bi-creator-landing
Microsoft documentation for Power BI admins: https://docs.microsoft.com/en-us/power-bi/service-admin-administering-power-bi-in-your-organization
Accessing the Reports
Quick start guide: https://docs.microsoft.com/en-us/power-bi/consumer/end-user-experience
Accessing reports as consumers: https://docs.microsoft.com/en-us/power-bi/consumer/power-bi-consumer-landing
Export to PDF: https://docs.microsoft.com/en-us/power-bi/desktop-export-to-pdf