Troubleshooting YSoft SafeQ FlexiSpooler high resource usage
How to troubleshoot situations when YSoft SafeQ FlexiSpooler consumes too much CPU or memory and how to identify the root cause so that we can fix it.
Logs
While logs are important, they are usually not sufficient to troubleshoot CPU spikes or memory consumption as these problems usually have quite complex causes not visible in the logs. This troubleshooting guide assumes that you collected all the relevant log files and focuses on the generating and collecting managed memory/thread dump files.
What is memory/thread dump?
For more information on dump files, you may refer to MSDN at: https://msdn.microsoft.com/en-us/library/d5zhxt22.aspx.
Setting up the Environment
To generate the dumps, we are going to use a ProcDump utility from SysInternals Suite.
You can download the whole suite here: https://technet.microsoft.com/en-us/sysinternals/bb842062
just the ProcDump utility here: https://technet.microsoft.com/en-us/sysinternals/dd996900.aspx
To analyze the dump, you can either use Visual Studio 2015 (or higher) or freely available Debugging Tools for Windows. This guide will focus on both.
Debugging Tools for Windows are best downloaded as part of Windows SDK (choose just Debugging Tools for Windows if you don't want to install anything else). The web-based installer for Windows SDK is available here: https://developer.microsoft.com/en-us/windows/downloads/windows-10-sdk
After you install the Debugging Tools for Windows, please point it to the Microsoft Symbol Store like this:
set environment variable _NT_SYMBOL_PATH=srv*C:\symbols*http://msdl.microsoft.com/downloads/symbols
Capturing the Process Dump
When you launch the ProcDump utility without any command line arguments, you get a dialog prompting you to accept the EULA. Do not forget that this dialog is shown on every single system you run ProcDump on, so to prevent this from happening, you should always use the -accepteula command line argument.
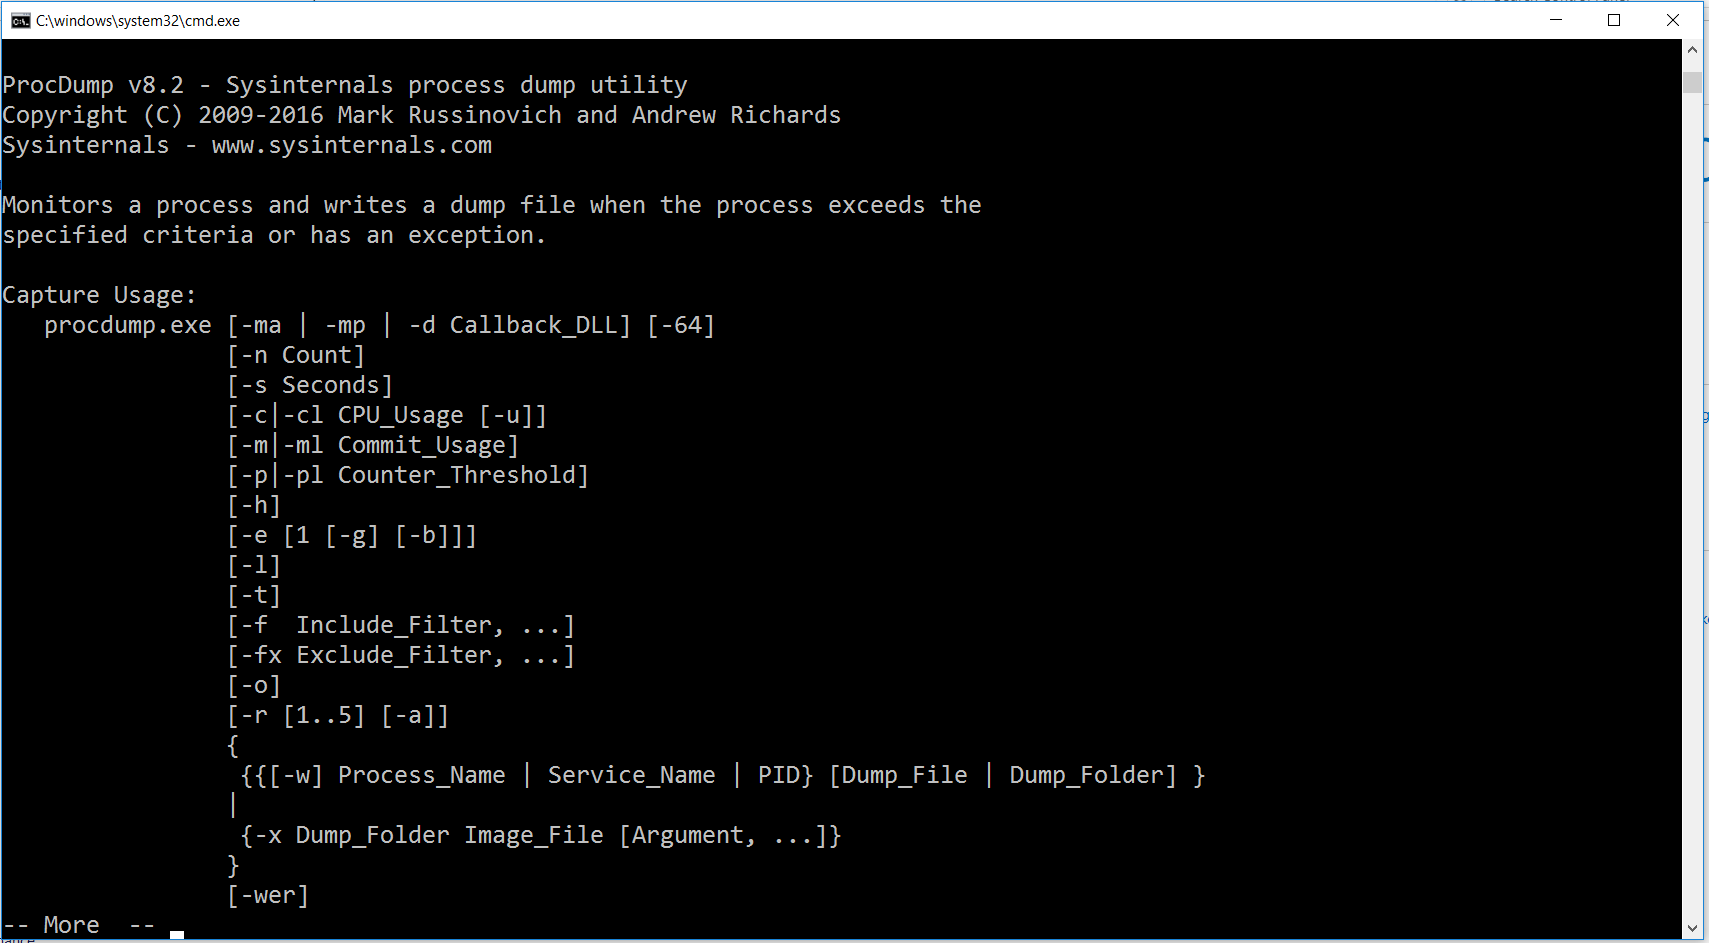
Anyhow, without command line arguments, ProcDump shows quite extensive help.

The documentation of all the arguments is available at the download page here: https://technet.microsoft.com/en-us/sysinternals/dd996900.aspx.
Dumping for Memory
If your focus is to diagnose memory consumption issues, such as memory leaks, you would probably go for the following switches:
Switch | Meaning | Value (if applicable) |
-l | Display the debug logging of the process (such as outputs from OutputDebugString(). | |
-m | Memory commit threshold. | Depending on the volume of printing. |
-ma | Write a dump file with all access memory and thread information. | |
-mp | Write a dump file with all access memory excluding large areas (caches) and thread information. | You do not need this one for FlexiSpooler. |
-r | Dump using a clone. | You should not need this one for FlexiSpooler. |
-s | Consecutive seconds before the dump is written. | 10-30 seconds |
-n | How many dumps to write. Usually use more than one, so you can compare. | 3 |
-t | Write one more dump when the process terminates. | |
-w | Wait for the process to launch. | |
-e | Write dump when there is an unhandled exception. |
Your command line (assuming you want to monitor FlexiSpooler.exe) could look like this:
procdump -l -m 800 -ma -r -s 30 -n 3 -t -w -accepteula FlexiSpooler.exe C:\DumpsIf it is done correctly, you will see output like this:
